Multiple Choice
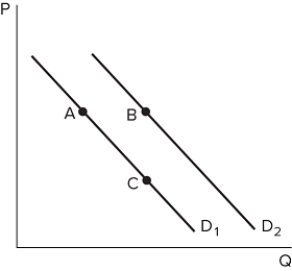 Suppose the graph shown depicts the demand for a normal good. A shift from A to B might be caused by:
Definitions:
Related Questions
Q54: If the price of a good is
Q68: Suppose a decrease in price increases quantity
Q69: <img src="https://d2lvgg3v3hfg70.cloudfront.net/TB8194/.jpg" alt=" In the market
Q82: Which of the following does not limit
Q91: A demand curve is a graph that:<br>A)
Q117: A college student decides to spend his
Q130: <img src="https://d2lvgg3v3hfg70.cloudfront.net/TB8194/.jpg" alt=" Suppose the market
Q136: If a good has an income elasticity
Q141: The concepts of comparative advantage, specialization, and
Q165: <img src="https://d2lvgg3v3hfg70.cloudfront.net/TB8194/.jpg" alt=" Assume the graph