Multiple Choice
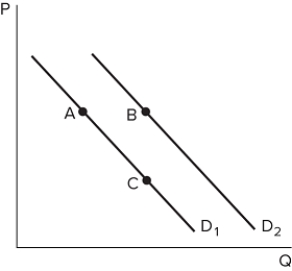 Suppose the graph shown depicts the demand for a normal good. Pasua was originally consuming at point A, but after receiving a raise at work her demand may:
Definitions:
Related Questions
Q7: If you generate a new idea that
Q19: If a good has an elastic demand,
Q27: Which of the following is a reason
Q32: If increasing the admission charge for national
Q58: <img src="https://d2lvgg3v3hfg70.cloudfront.net/TB8194/.jpg" alt=" If a price
Q64: The drug approval process regulated by the
Q74: Suppose an American worker can make 20
Q89: The principles of economics can explain which
Q92: Suppose when the price of coffee beans
Q97: Equilibrium takes place where:<br>A) supply and demand