Multiple Choice
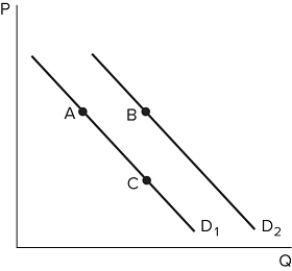 Suppose the graph shown depicts the demand for a normal good. A shift from A to B might be caused by:
Definitions:
Related Questions
Q2: An increase in price causes:I. a decrease
Q15: A linear demand curve:<br>A) has a constant
Q25: Suppose Hassan wants to rent a house
Q25: Assume there are three hardware stores, each
Q27: At prices above a consumer's willingness to
Q36: Limited capabilities often affect _ the most.<br>A)
Q48: Suppose the government would like to reduce
Q69: Coke and Pepsi, both cola producers, likely
Q103: Consider a market that is in equilibrium.
Q119: The purpose of an economic model is