The graph shown displays various price and output levels in an economy. 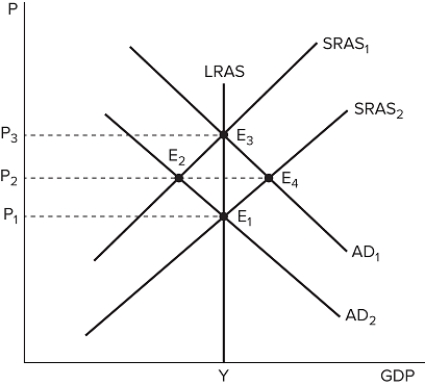 What does the "Y" on the x-axis stand for?
Definitions:
Flexibility Option
An option that provides the holder with the ability to adapt or change an investment based on changing circumstances.
Inputs/Outputs
In economics and business, inputs refer to the resources used in the production process, while outputs are the goods or services produced.
Expected Net Present Value
The anticipated value in today's terms of future cash flows from an investment minus the initial investment cost, considering various possible outcomes.
Industry Standard
The generally accepted requirements, practices, or criteria within a particular industry or sector.
Q7: The U.S. gives foreign aid primarily through:<br>A)
Q21: In an effort to improve health care,
Q53: Investments in a person's home country are
Q77: Shoe-leather costs refer to:<br>A) the money, time,
Q85: A larger money multiplier means:<br>A) the reserve
Q99: If a country allows the value of
Q102: In the market for loanable funds in
Q113: Unpredictable inflation can lead businesses to:<br>A) experience
Q127: What is the essential function of any
Q150: Which of the following is not considered