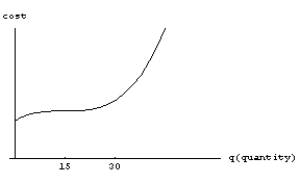
The graph of a cost function is given in the following figure. Estimate the value of q at which average cost is minimized. 
Definitions:
Market Price
The existing rate at which an item or service may be traded or acquired in a commercial setting.
Market Output
The total amount of goods or services produced and offered for sale by businesses in a particular market.
External Costs
Costs that are not borne by the producer or consumer of a good or service but by society, such as pollution.
Q38: Given the following data about the function
Q43: A family invests in a snow cone
Q46: Every day a person consumes 6 micrograms
Q52: Given the following graph of <img src="https://d2lvgg3v3hfg70.cloudfront.net/TB8190/.jpg"
Q53: The following figure gives the density function
Q64: The following figure shows a density function
Q83: For <img src="https://d2lvgg3v3hfg70.cloudfront.net/TB8190/.jpg" alt="For and
Q85: Given the following data about the function,
Q102: The following table gives the number of
Q118: Using a calculator, estimate the derivative of