Short Answer
The graph below shows the velocity of an object (in meters/second). Find an upper bound for the number of meters traveled from t = 1 to t = 5 seconds. 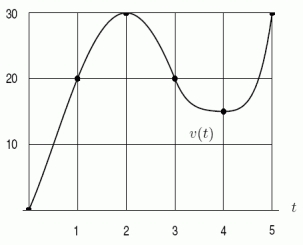
Definitions:
Related Questions
Q4: Bäckman et al. (2000)found a sizable correlation
Q10: Simplify <img src="https://d2lvgg3v3hfg70.cloudfront.net/TB8190/.jpg" alt="Simplify ,
Q16: Mather and Carstensen (2005)argue that as people
Q28: A biologist found that the number of
Q54: Estimate the area of the region under
Q65: Find <img src="https://d2lvgg3v3hfg70.cloudfront.net/TB8190/.jpg" alt="Find using
Q67: Total cost and revenue are approximated by
Q68: Find <img src="https://d2lvgg3v3hfg70.cloudfront.net/TB8190/.jpg" alt="Find using
Q75: This figure shows the rate of change
Q193: Sketch a well-labeled graph of a periodic