Exhibit 10-3
The graph below shows a plot of angular velocity in rad/s versus time in s from t = 0 s to t = 7 s. 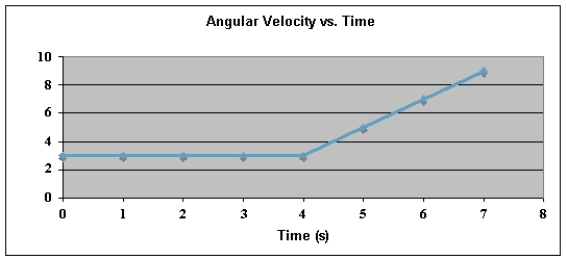 Use this exhibit to answer the following question(s) .
-Refer to Exhibit 10-3. The change in angular position, Δθ, during the 7-second period is
Definitions:
Q7: At the moment of a total eclipse,
Q12: The superposition of two waves, <img src="https://d2lvgg3v3hfg70.cloudfront.net/TB8245/.jpg"
Q15: Equal masses of hydrogen and helium gas
Q16: Sebastian has drawn a free-body diagram for
Q21: When water freezes, it expands about nine
Q31: The speed of a 10-kHz sound wave
Q32: Expand Your Knowledge: Geometric Mean When data
Q48: The superposition of two waves <img src="https://d2lvgg3v3hfg70.cloudfront.net/TB8245/.jpg"
Q50: Basic Computation: Multiplication Rule Given P(A) =
Q94: Survey: Customer Loyalty Are customers more loyal