Multiple Choice
The figure below shows a graph of angular velocity as a function of time for a car driving around a circular track. Through how many radians does the car travel in the first 10 minutes? 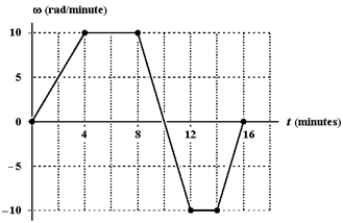
Definitions:
Related Questions
Q13: A uniform rod of mass M =
Q16: Refer to Exhibit 10-1. How many revolutions
Q35: The figure below shows a planet traveling
Q39: Space Shuttle: Epoxy Kevlar epoxy is a
Q41: Critical Thinking Describe how data outliers might
Q43: If L represents angular momentum, I represents
Q45: A satellite of mass m circles a
Q51: Which of the following substances has the
Q85: General: Roll a Die <br>(a) If you
Q86: Critical Thinking Consider the following events for