TABLE 2-16
The figure below is the percentage polygon for the amount of calories for a sample of 36 pizzas products where the upper limits of the intervals are: 310, 340, 370, 400 and 430.
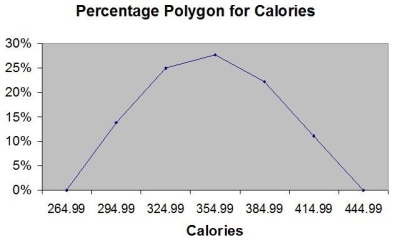
-Referring to Table 2-16, roughly what percentage of pizza products contains between 400 and 430 calories?
Definitions:
Q4: The amount of calories contained in a
Q12: Referring to Table 3-2,the median carbohydrate amount
Q25: Referring to Table 5-8,what is your expected
Q64: Referring to Table 2-14,if the sample is
Q75: The probability that a new advertising campaign
Q129: Referring to Table 2-12,if the sample is
Q138: The coefficient of variation is a measure
Q139: Referring to Table 3-7,what are the (absolute
Q161: A company has 2 machines that produce
Q210: When constructing charts,the following is plotted at