TABLE 5-8
Two different designs on a new line of winter jackets for the coming winter are available for your manufacturing plants. Your profit (in thousands of dollars) will depend on the taste of the consumers when winter arrives. The probability of the three possible different tastes of the consumers and the corresponding profits are presented in the following table.
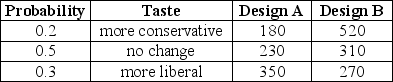
-Referring to Table 5-8, what is the total variance of the profit if you increase the shift of your production lines and choose to produce both designs?
Definitions:
One-tailed Test
A statistical test that determines the direction of a relationship or difference, testing for either a positive or negative effect only.
Directional Research Hypothesis
A hypothesis that specifies the direction of the expected difference or relationship between the variables being studied.
Research Hypothesis
A statement predicting the relationship between variables, formulated to be tested by research.
Null
Typically refers to the null hypothesis in statistical analysis, which posits that there is no significant difference or relationship between specified populations, any observed difference being due to sampling or experimental error.
Q12: Given a sample mean of 2.1 and
Q17: Referring to Table 3-4,construct a boxplot of
Q50: There are 47 contestants at a national
Q50: Referring to Table 7-6,the population mean of
Q70: Referring to Table 5-8,what is your expected
Q73: The expected return of the sum of
Q84: The median of the values 3.4,4.7,1.9,7.6,and 6.5
Q96: The probability that house sales will increase
Q166: The probability that a standard normal random
Q168: Which of the following yields a simple