TABLE 12-20
Three new different models of compact SUVs have just arrived at the market. You are interested in comparing the gas mileage performance of all three models to see if they are the same. A partial computer output for twelve compact SUVs of each model is given below:
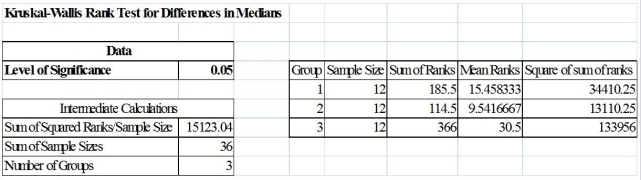
You are told that the gas mileage population distributions for all three models are not normally distributed.
-Referring to Table 12-20, what are the degrees of freedom of the Kruskal-Wallis test statistic?
Definitions:
Trading (Debt) Securities
Financial instruments, such as bonds or notes, that are bought and sold with the intention of making a profit from short-term price fluctuations.
Historical Cost
The original monetary value of an asset or expense as recorded at the time of purchase or acquisition.
Fair Value
An estimate of the price at which an asset would trade in a competitive auction setting.
Long-Term Investments
Assets that a company intends to hold for more than one fiscal year, such as stocks, bonds, real estate, or investments in other companies.
Q2: If the Durbin-Watson statistic has a value
Q2: Referring to Table 12-16,in order to perform
Q7: Referring to Table 12-11,the same decision would
Q43: The sample correlation coefficient between X and
Q55: The Journal of Business Venturing reported on
Q125: Referring to Table 14-17 Model 1,which of
Q133: Referring to 14-16,there is enough evidence to
Q195: Referring to Table 10-14,what is the largest
Q200: In a one-way ANOVA,if the computed F
Q315: Referring to Table 14-17 Model 1,the null