TABLE 13-4
The managers of a brokerage firm are interested in finding out if the number of new clients a broker brings into the firm affects the sales generated by the broker. They sample 12 brokers and determine the number of new clients they have enrolled in the last year and their sales amounts in thousands of dollars. These data are presented in the table that follows. 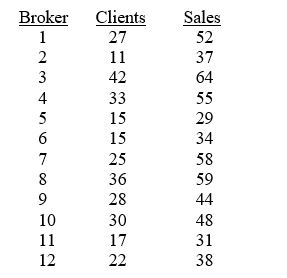
-Referring to Table 13-4, suppose the managers of the brokerage firm want to construct n a 99% prediction interval for the sales made by a broker who has brought into the firm 18 new clients. The t critical value they would use is ________.
Definitions:
Cost Estimation
The process of predicting the amount of resources, especially financial, required to complete a project or product development within specified constraints.
Scatter Diagram
A graphical representation used to show the relationship between two variables, helping to identify potential correlations.
Relevant Range
The range of activity within which the assumptions made about cost behavior in cost-volume-profit analysis are valid.
Cost Estimates
A predictive calculation of the anticipated expenses for a project or production, used for budgeting and planning purposes.
Q49: Assuming a linear relationship between X and
Q87: The coefficient of multiple determination measures the
Q88: Referring to Table 10-14,what is the critical
Q111: Referring to Table 11-8,what is the critical
Q134: Referring to Table 14-5,what is the p-value
Q141: The McNemar test is approximately distributed as
Q150: Referring to Table 13-4,the least squares estimate
Q177: Referring to Table 11-12,the critical value of
Q199: Referring to Table 12-2,the hypotheses the dean
Q342: Referring to Table 14-15,what is the p-value