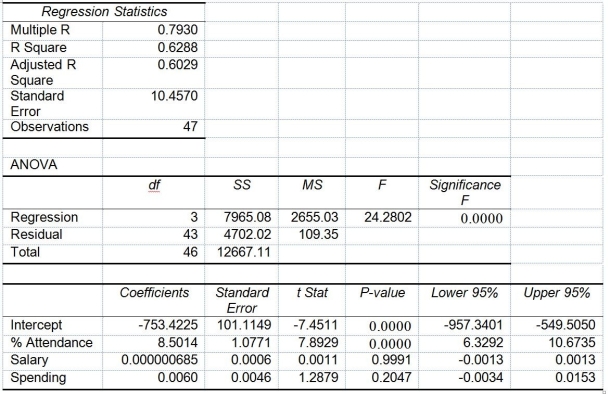
TABLE 14-15
The superintendent of a school district wanted to predict the percentage of students passing a sixth-grade proficiency test. She obtained the data on percentage of students passing the proficiency test (% Passing), daily mean of the percentage of students attending class (% Attendance), mean teacher salary in dollars (Salaries), and instructional spending per pupil in dollars (Spending) of 47 schools in the state.
Following is the multiple regression output with Y = % Passing as the dependent variable, X₁ = % Attendance, X₂= Salaries and X₃= Spending:

-Referring to Table 14-15, what are the lower and upper limits of the 95% confidence interval estimate for the effect of a one dollar increase in mean teacher salary on the mean percentage of students passing the proficiency test?
Definitions:
Standard of Living
The level of wealth, comfort, material goods, and necessities available to a person, group, or nation.
Natural Rate
The long-term rate of unemployment expected in an economy, factoring in frictional and structural unemployment.
Constant Over Time
Refers to a variable or a condition that does not change as time progresses, remaining stable in both the short term and the long term.
Bureau of Labor Statistics
A U.S. government agency responsible for collecting and analyzing labor economics and statistics.
Q29: Referring to Table 15-4,what is the p-value
Q32: Referring to Table 14-19,what is the p-value
Q36: The MAD is a measure of the
Q50: A high value of R² significantly above
Q88: Referring to Table 13-4,_ % of the
Q126: Referring to Table 13-5,the estimates of the
Q126: Referring to Table 12-16,what is the value
Q173: Referring to Table 13-5,the prediction for a
Q181: Referring to Table 13-1,interpret the estimate of
Q300: Referring to Table 14-4,suppose the builder wants