TABLE 14-15
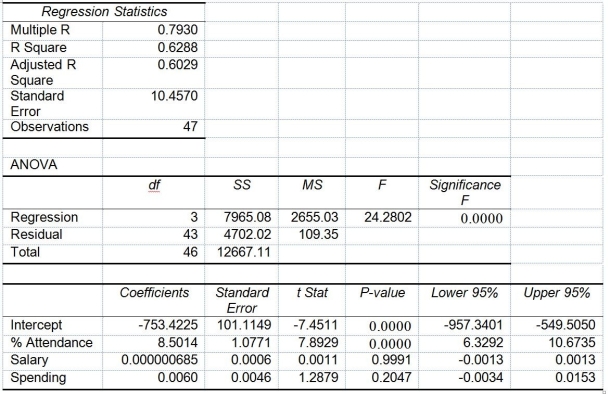
The superintendent of a school district wanted to predict the percentage of students passing a sixth-grade proficiency test. She obtained the data on percentage of students passing the proficiency test (% Passing), daily mean of the percentage of students attending class (% Attendance), mean teacher salary in dollars (Salaries), and instructional spending per pupil in dollars (Spending) of 47 schools in the state.
Following is the multiple regression output with Y = % Passing as the dependent variable, X₁ = % Attendance, X₂= Salaries and X₃= Spending:

-Referring to Table 14-15, you can conclude that mean teacher salary has no impact on the mean percentage of students passing the proficiency test at a 5% level of significance using the 95% confidence interval estimate for β₂.
Definitions:
Strategic Intent
A company's clear and concrete aim to achieve a specific goal or set of objectives, guiding its strategy and actions.
Transformational Leadership
A leadership approach that causes change in individuals and social systems, inspiring followers to exceed their own interests for the good of the group or organization.
Visionary Leadership
Visionary leadership is a leadership style where the leader is able to articulate a compelling vision for the future, inspiring and motivating others to achieve long-term goals.
Budget
A plan that commits resources to projects or activities.
Q36: Referring to Table 12-16,the parameter of interest
Q53: Referring to Table 12-19,the calculated value of
Q65: Referring to Table 14-19,what is the p-value
Q84: Referring to Table 16-12,in testing the significance
Q86: Referring to Table 14-17 Model 1,what is
Q122: The slope (b₁)represents<br>A)predicted value of Y when
Q127: Referring to Table 13-2,what is the standard
Q181: Referring to Table 13-1,interpret the estimate of
Q198: Referring to Table 13-10,it is inappropriate to
Q315: Referring to Table 14-17 Model 1,the null