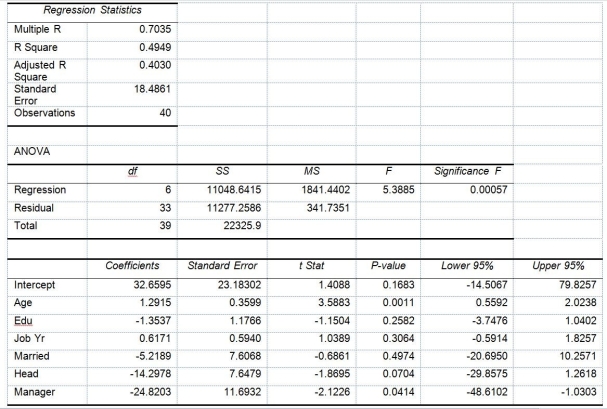
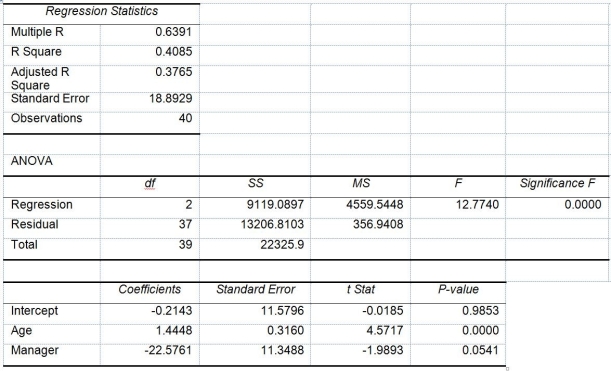
TABLE 14-17


Model 2 is the regression analysis where the dependent variable is Unemploy and the independent variables are
Age and Manager. The results of the regression analysis are given below:

-Referring to Table 14-17 and using both Model 1 and Model 2, the null hypothesis for testing whether the independent variables that are not significant individually are also not significant as a group in explaining the variation in the dependent variable should be rejected at a 5% level of significance?
Definitions:
Error Variable \(ε\)
A term in regression models representing the difference between observed and predicted values, capturing unexplained or random effects.
Student t-Distribution
Describes the frequency and probability distribution of sample means when the sample size is small and the population standard deviation is unknown.
Population Regression Line
A statistical estimate that expresses the relationship between one dependent variable and one or more independent variables for an entire population.
Sample Coefficient
A statistical measure calculated from a sample of data, used to estimate the characteristics or parameters of a population.
Q15: A second-order autoregressive model for average mortgage
Q17: Referring to Table 13-5,the standard error of
Q57: Referring to Table 16-13,what is your forecast
Q67: Referring to Table 17-9,construct an <img src="https://d2lvgg3v3hfg70.cloudfront.net/TB1605/.jpg"
Q80: Referring to 14-16,there is enough evidence to
Q108: Referring to Table 13-7,to test whether the
Q178: Referring to Table 13-12,the p-value of the
Q204: Referring to Table 13-9,the value of the
Q310: An interaction term in a multiple regression
Q348: Referring to Table 14-7,the department head wants