TABLE 15-6
Given below are results from the regression analysis on 40 observations where the dependent variable is the number of weeks a worker is unemployed due to a layoff (Y) and the independent variables are the age of the worker (X₁), the number of years of education received (X₂), the number of years at the previous job (X₃), a dummy variable for marital status (X₄: 1 = married, 0 = otherwise), a dummy variable for head of household (X₅: 1 = yes, 0 = no) and a dummy variable for management position (X₆: 1 = yes, 0 = no).
The coefficient of multiple determination (R) for the regression model using each of the 6 variables Xⱼ as the dependent variable and all other X variables as independent variables are, respectively, 0.2628, 0.1240, 0.2404, 0.3510, 0.3342 and 0.0993.
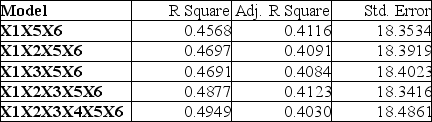
The partial results from best-subset regression are given below:
-Referring to Table 15-6, the variable X₁ should be dropped to remove collinearity.
Definitions:
Stable Demand
A market condition where the desire for a product or service remains constant over a period of time.
Forecast
A prediction or estimate of future events or conditions based on available data or trends.
Supply Chain
The network of all the individuals, organizations, resources, activities, and technology involved in the creation and sale of a product, from the delivery of source materials from the supplier to the manufacturer, and eventually to the end user.
Distortion
Alteration or warping of information, perception, or reality, often leading to misunderstanding or misinterpretation.
Q14: Referring to Table 14-17 Model 1,we can
Q22: Four surgical procedures currently are used to
Q27: Referring to Table 14-8,the F test for
Q29: Referring to Table 17-5,a p control chart
Q50: Referring to Table 16-12,using the regression equation,what
Q50: A survey was conducted to determine how
Q136: Referring to Table 7-2,what proportion of the
Q168: Referring to Table 16-6,the fitted trend value
Q186: Referring to Table 6-1 and assuming that
Q278: Referring to Table 14-15,what is the standard