TABLE 15-6
Given below are results from the regression analysis on 40 observations where the dependent variable is the number of weeks a worker is unemployed due to a layoff (Y) and the independent variables are the age of the worker (X₁), the number of years of education received (X₂), the number of years at the previous job (X₃), a dummy variable for marital status (X₄: 1 = married, 0 = otherwise), a dummy variable for head of household (X₅: 1 = yes, 0 = no) and a dummy variable for management position (X₆: 1 = yes, 0 = no).
The coefficient of multiple determination (R) for the regression model using each of the 6 variables Xⱼ as the dependent variable and all other X variables as independent variables are, respectively, 0.2628, 0.1240, 0.2404, 0.3510, 0.3342 and 0.0993.
The partial results from best-subset regression are given below:
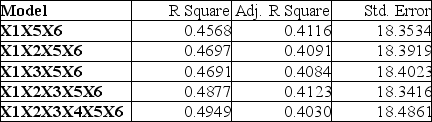
-Referring to Table 15-6, the model that includes X₁, X₂, X₃, X₅ and X₆ should be selected using the adjusted r² statistic.
Definitions:
Annuity
A financial product that pays out a fixed stream of payments to an individual, typically used as part of retirement planning.
Discount Rate
The interest rate by which future cash flows are devalued to their present worth in a DCF analysis.
Cash Flows
represent the net amount of cash and cash-equivalents being transferred into and out of a business.
Zero-Interest Financing
Zero-Interest Financing is a loan or credit offer with a 0% interest rate for a set period, making purchases more affordable upfront but often requiring a good credit score.
Q11: Given a data set with 15 yearly
Q13: Referring to Table 17-9,an R chart is
Q68: Referring to Table 14-19,which of the following
Q94: Referring to Table 7-1,what is the probability
Q98: The use of the finite population correction
Q123: Common causes of variation are correctable without
Q130: Referring to Table 17-3,suppose the analyst constructs
Q184: Referring to Table 14-17 Model 1,the alternative
Q188: For a given level of significance,if the
Q263: Referring to Table 14-15,there is sufficient evidence