TABLE 16-13
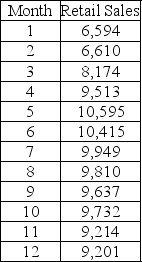
Given below is the monthly time-series data for U.S. retail sales of building materials over a specific year.

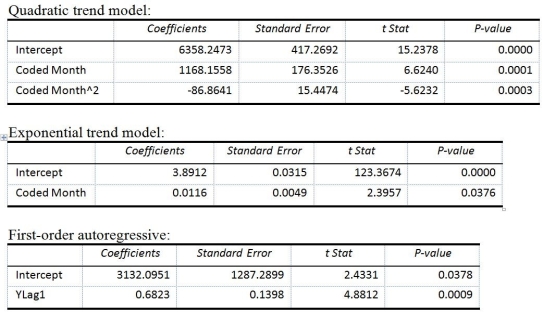
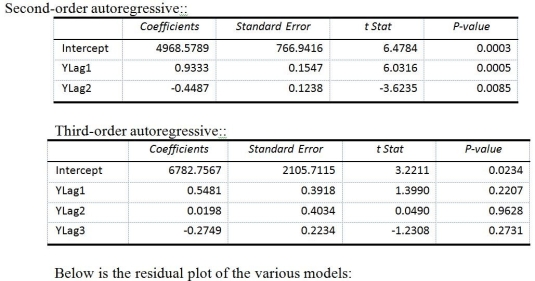
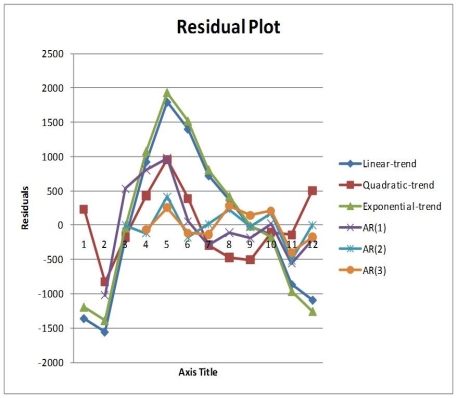
The results of the linear trend, quadratic trend, exponential trend, first-order autoregressive, second-order autoregressive and third-order autoregressive model are presented below in which the coded month for the first month is 0:


-Referring to Table 16-13, you can reject the null hypothesis for testing the appropriateness of the third-order autoregressive model at the 5% level of significance.
Definitions:
Predictive Modeling
The process of using statistical techniques and algorithms to forecast outcomes based on historical data.
Internal Company Data
Information generated within a company, including financial records, employee details, and operational statistics, used for analysis and strategic decision-making.
Sales Force Reports
Documents or data summaries that provide insights into the activities, performance, and outcomes of a company's sales team.
Customer Support Records
Documentation and data compilation that track interactions, support issues, and resolutions between a company and its customers.
Q8: A supplier of silicone sheets for producers
Q8: Referring to Table 9-2,if you select a
Q50: Referring to Table 17-7,what is the value
Q54: Referring to Table 14-19,which of the following
Q79: Referring to Table 14-19,what are the degrees
Q79: Collinearity is present when there is a
Q93: Which of the following methods should not
Q127: Unweighted aggregate price indices account for differences
Q131: The CPL and CPU indexes are used
Q245: Referring to Table 14-8,the net regression coefficient