TABLE 16-2
Given below are the prices of a basket of four food items from 2006 to 2010.
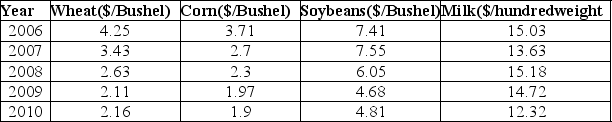
-Referring to Table 16-2, what is the Laspeyres price index for the basket of four food items in 2010 that consisted of 50 bushels of wheat, 30 bushels of corn, 40 bushels of soybeans and 80 hundredweight of milk in 2006 using 2006 as the base year?
Definitions:
100% Learning Curve
An idealized scenario where individuals or systems instantly achieve full proficiency or efficiency in a new task or process, without any learning time or efficiency improvement curve.
Direct Labour
Consists of work done by employees directly involved in the manufacturing process or providing services, as opposed to indirect labor which supports production.
70% Learning Curve
A graphical representation indicating that each time the total quantity of units produced doubles, the time or cost per unit reduces to 70% of its previous value, reflecting increased efficiency.
Production Volume
The quantity of goods or products that are manufactured or processed in a certain period.
Q13: The _ is the average observed time
Q25: Special or assignable causes of variation are
Q59: A lot of 1,000 items is on
Q66: A single-sampling plan by attributes is needed
Q78: Referring to Table 17-9,based on the <img
Q104: Referring to Table 19-5,what is the optimal
Q106: Referring to Table 16-5,the number of arrivals
Q140: Referring to Table 6-1 and assuming that
Q194: Referring to Table 19-2,what is the action
Q321: As a general rule,one can use the