Table 5.11
Factors for Calculating Three-Sigma Limits for the
Chart and R-Chart
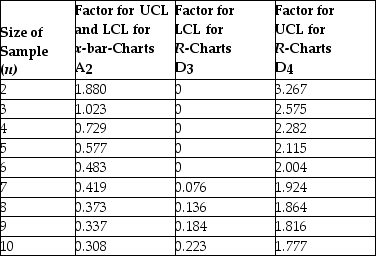
Source: 1950 ASTM Manual on Quality Control of Materials, copyright American Society for Testing Materials. Reprinted with permission.
-Thermostats are subjected to rigorous testing before they are shipped to air conditioning technicians around the world. Results from the last five samples are shown in the table. Create control charts that will fully monitor the process and indicate the result of X-bar and R-chart analysis. 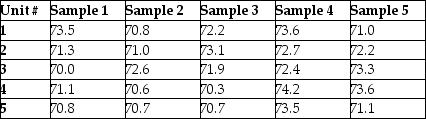
Definitions:
Position Power
The authority and influence granted to individuals by their role or position within an organization, allowing them to direct others.
Path-Goal Theory
A leadership theory that suggests a leader's behavior is contingent to the satisfaction, motivation, and performance of their subordinates.
Frustrating Barriers
Frustrating Barriers are obstacles or hindrances that create significant stress or irritation, often impeding progress or achievement.
Normative Decision Model
A framework used in decision-making that outlines how to choose the best possible strategy based on the situation's norms and criteria.
Q5: _ is the degree to which equipment,
Q10: Use the information provided in Table 1.1.
Q43: The supplier relationship process selects the suppliers
Q51: It takes the Blacksburg shipyard twenty six
Q72: The foundations of modern manufacturing and technological
Q107: A manager weighs three options for capacity
Q116: With respect to the systems approach of
Q131: One big advantage of lean systems is
Q159: _ are different operations within a facility
Q179: The advantage of variable measurements is that