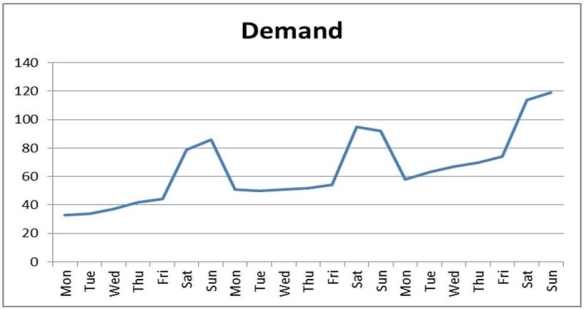
Graph 8.1
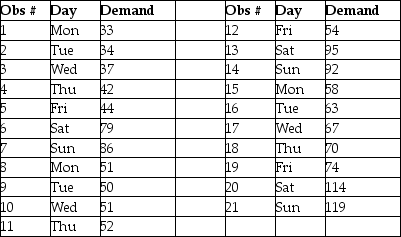
Data plotted in the graph appear in the table below.


-Refer to Graph 8.1. Which term most accurately describes the data points associated with Saturdays and Sundays?
Definitions:
Effective Introduction
The initial section of a document or speech designed to capture the audience's attention, provide essential background, and set the stage for the content that follows.
Jargon
Specialized language used by a particular group or profession that may be difficult for outsiders to understand.
Text Size
The dimension of letters and characters in a written or digital document, affecting readability and visual appeal.
Presentation Visuals
Visual elements such as slides, charts, or videos used to enhance understanding and engagement during a presentation.
Q12: Following the project defining and organizing phase,
Q45: Which one of the following statements about
Q52: The periodic order quantity (POQ) rule tends
Q85: Which one of the following statements about
Q106: The rack at my assembly station that
Q126: If the inventory advantages of a lean
Q130: Using Table 7.9, what is the difference,
Q144: One component of the holding cost of
Q178: Use the information in Scenario 9.9 to
Q203: The term lot size signifies:<br>A) the total