Examlex

Solved

The Reaction Times to Three Stimuli Were Recorded for Each

question 176

Essay

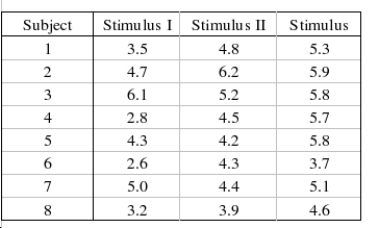
The reaction times to three stimuli were recorded for each of 8 subjects. The data, recorded in seconds, are shown below. This problem uses Friedman's The reaction times to three stimuli were recorded for each of 8 subjects. The data, recorded in seconds, are shown below. This problem uses Friedman's   test to determine if there is a difference among the population distributions of reaction times.   What experimental design is being used in this problem? ____________________________ The null and alternate hypotheses are as follows:   : The three population distributions are identical.   : At least two of the three population distributions differ in location. Describe what the Test statistic   is. ________________________________________________________ Test statistic:   = ______________ Rejection region for   =0.05: Reject   if   > ______________ Conclusion: ______________ There is ______________ evidence to conclude that the reaction times for the three stimuli are different. Estimate the p-value for this problem? ______________ test to determine if there is a difference among the population distributions of reaction times. The reaction times to three stimuli were recorded for each of 8 subjects. The data, recorded in seconds, are shown below. This problem uses Friedman's   test to determine if there is a difference among the population distributions of reaction times.   What experimental design is being used in this problem? ____________________________ The null and alternate hypotheses are as follows:   : The three population distributions are identical.   : At least two of the three population distributions differ in location. Describe what the Test statistic   is. ________________________________________________________ Test statistic:   = ______________ Rejection region for   =0.05: Reject   if   > ______________ Conclusion: ______________ There is ______________ evidence to conclude that the reaction times for the three stimuli are different. Estimate the p-value for this problem? ______________ What experimental design is being used in this problem?
____________________________
The null and alternate hypotheses are as follows: The reaction times to three stimuli were recorded for each of 8 subjects. The data, recorded in seconds, are shown below. This problem uses Friedman's   test to determine if there is a difference among the population distributions of reaction times.   What experimental design is being used in this problem? ____________________________ The null and alternate hypotheses are as follows:   : The three population distributions are identical.   : At least two of the three population distributions differ in location. Describe what the Test statistic   is. ________________________________________________________ Test statistic:   = ______________ Rejection region for   =0.05: Reject   if   > ______________ Conclusion: ______________ There is ______________ evidence to conclude that the reaction times for the three stimuli are different. Estimate the p-value for this problem? ______________ : The three population distributions are identical. The reaction times to three stimuli were recorded for each of 8 subjects. The data, recorded in seconds, are shown below. This problem uses Friedman's   test to determine if there is a difference among the population distributions of reaction times.   What experimental design is being used in this problem? ____________________________ The null and alternate hypotheses are as follows:   : The three population distributions are identical.   : At least two of the three population distributions differ in location. Describe what the Test statistic   is. ________________________________________________________ Test statistic:   = ______________ Rejection region for   =0.05: Reject   if   > ______________ Conclusion: ______________ There is ______________ evidence to conclude that the reaction times for the three stimuli are different. Estimate the p-value for this problem? ______________ : At least two of the three population distributions differ in location.
Describe what the Test statistic The reaction times to three stimuli were recorded for each of 8 subjects. The data, recorded in seconds, are shown below. This problem uses Friedman's   test to determine if there is a difference among the population distributions of reaction times.   What experimental design is being used in this problem? ____________________________ The null and alternate hypotheses are as follows:   : The three population distributions are identical.   : At least two of the three population distributions differ in location. Describe what the Test statistic   is. ________________________________________________________ Test statistic:   = ______________ Rejection region for   =0.05: Reject   if   > ______________ Conclusion: ______________ There is ______________ evidence to conclude that the reaction times for the three stimuli are different. Estimate the p-value for this problem? ______________ is.
________________________________________________________
Test statistic: The reaction times to three stimuli were recorded for each of 8 subjects. The data, recorded in seconds, are shown below. This problem uses Friedman's   test to determine if there is a difference among the population distributions of reaction times.   What experimental design is being used in this problem? ____________________________ The null and alternate hypotheses are as follows:   : The three population distributions are identical.   : At least two of the three population distributions differ in location. Describe what the Test statistic   is. ________________________________________________________ Test statistic:   = ______________ Rejection region for   =0.05: Reject   if   > ______________ Conclusion: ______________ There is ______________ evidence to conclude that the reaction times for the three stimuli are different. Estimate the p-value for this problem? ______________ = ______________
Rejection region for The reaction times to three stimuli were recorded for each of 8 subjects. The data, recorded in seconds, are shown below. This problem uses Friedman's   test to determine if there is a difference among the population distributions of reaction times.   What experimental design is being used in this problem? ____________________________ The null and alternate hypotheses are as follows:   : The three population distributions are identical.   : At least two of the three population distributions differ in location. Describe what the Test statistic   is. ________________________________________________________ Test statistic:   = ______________ Rejection region for   =0.05: Reject   if   > ______________ Conclusion: ______________ There is ______________ evidence to conclude that the reaction times for the three stimuli are different. Estimate the p-value for this problem? ______________ =0.05:
Reject The reaction times to three stimuli were recorded for each of 8 subjects. The data, recorded in seconds, are shown below. This problem uses Friedman's   test to determine if there is a difference among the population distributions of reaction times.   What experimental design is being used in this problem? ____________________________ The null and alternate hypotheses are as follows:   : The three population distributions are identical.   : At least two of the three population distributions differ in location. Describe what the Test statistic   is. ________________________________________________________ Test statistic:   = ______________ Rejection region for   =0.05: Reject   if   > ______________ Conclusion: ______________ There is ______________ evidence to conclude that the reaction times for the three stimuli are different. Estimate the p-value for this problem? ______________ if The reaction times to three stimuli were recorded for each of 8 subjects. The data, recorded in seconds, are shown below. This problem uses Friedman's   test to determine if there is a difference among the population distributions of reaction times.   What experimental design is being used in this problem? ____________________________ The null and alternate hypotheses are as follows:   : The three population distributions are identical.   : At least two of the three population distributions differ in location. Describe what the Test statistic   is. ________________________________________________________ Test statistic:   = ______________ Rejection region for   =0.05: Reject   if   > ______________ Conclusion: ______________ There is ______________ evidence to conclude that the reaction times for the three stimuli are different. Estimate the p-value for this problem? ______________ > ______________
Conclusion: ______________
There is ______________ evidence to conclude that the reaction times for the three stimuli are different.
Estimate the p-value for this problem?
______________


Definitions:

Passive Approach

A strategy or method where actions and decisions are reactive rather than proactive, often characterized by minimal or no intervention.

Government Act

A piece of legislation that has been passed by a legislative body, such as a parliament or congress, and formally enacted into law.

Phillips Curve

A theoretical inverse relationship between rates of unemployment and corresponding rates of inflation, suggesting that inflation rises as unemployment falls, and vice versa.

Aggregate Demand

The aggregate demand for every good and service within a certain economy or market.

Related Questions