To investigate the effect of sleep on basal metabolism, seven college students who averaged seven or more hours of sleep a night (Group A), and five students who averaged less than seven hours of sleep a night (Group B), were examined and their basal metabolism recorded as shown below. 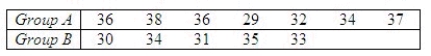 Since it was not clear whether the assumptions for a t-test were valid, the researcher decided to employ nonparametric methods. Use the Wilcoxon rank sum procedure to determine whether the metabolism measurements for Group A are significantly higher than those of Group B. Use
  = 0.05.
The null and alternate hypotheses are as follows:  : The distributions of metabolism measurements for the two groups are identical.
  : The distribution of metabolism measurements for Group B is shifted to the left of Group A. (i.e., the metabolism measurements are lower for Group B)
What is the test statistic?  : ______________
What is the critical value for the test statistic?
______________
Thus: ______________
Conclude:
We ______________ conclude the distribution of metabolism measurements for Group B is lower than those for Group A.
Definitions:
Normal Curve
A symmetric, bell-shaped curve that represents the distribution of many types of data where most values cluster around the mean.
Standard Deviations
A measure of the amount of variation or dispersion in a set of values, indicating how spread out the values are from the mean.
Mean
In statistics, it refers to the average value in a set of numbers, calculated by dividing the sum of all values by the number of values.
Scatterplot
A graphical representation displaying the relationship between two quantitative variables.
Q20: Discuss the Constitutional structure of the U.S.
Q21: The U.S. _ form of government is
Q40: Explain the policy process model presented by
Q50: In a normal approximation to the Wilcoxon
Q55: A librarian knows from old records that
Q68: In a simple linear regression model, if
Q73: A dependent variable is the variable that
Q97: A stochastic relationship is a relationship between
Q106: Suppose that a response can fall into
Q120: Which one of the following is a