Two gourmets, A and B, rated 22 meals on a scale of 1 to 10. The data are shown in the table. Do the data provide sufficient evidence to indicate that one of the gourmets tends to give higher ratings than the other? 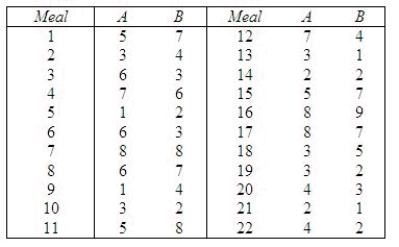 Test by using the sign test with a value of
  near 0.05.
The null and alternate hypotheses are as follows:  Critical Value approach:
What is the test statistic?
______________
Use the binomial tables to find the exact rejection region for the test.
Reject  if x
if x  ______________ or x
  ______________
Conclude:
______________
There ______________ enough evidence to indicate a difference between the two gourmets.
p-value approach:
Test Statistic:
______________
p-value = ______________
Conclude:
______________
There is ______________ enough evidence to indicate a difference between the two gourmets.
Use the large-sample z statistic for testing. (NOTE: Although the large-sample Approximation is suggested for  25, it works fairly well for values of n as small as 15.)
The large sample z-statistic is:
______________
The two-tailed rejection region is |z| > ______________.
Conclude:
______________
There is ______________ enough evidence to indicate a difference between the two gourmets.
Compare the results of the two tests.
The two tests give ______________ results.
Definitions:
New-Car Purchase
The process involving the selection, negotiation, and financial transaction required to buy a brand-new vehicle from a dealership or manufacturer.
Promotional Information
Communication aimed at informing, persuading, and influencing buying behavior by highlighting the benefits and values of a product or service.
Problem Recognition
The initial step in the consumer decision process, where the consumer identifies a need or problem that requires satisfaction or solution.
Consumer Purchase Decision
The process by which individuals select, purchase, use, and dispose of goods and services.
Q7: What kind of information would you want
Q8: The poverty line for a family of
Q39: Identify a particular public policy problem and
Q51: Passage of the _, discussed extensively in
Q52: If two variables are related in a
Q57: Because of greater decentralization of policy making
Q89: A sports enthusiast believes that among sports
Q113: To investigate the effect of sleep on
Q115: Suppose that you fit the model <img
Q143: In order to test the usefulness of