Americans are very vocal about their attempts to improve personal well-being by "eating right and exercising more." One desirable dietary change is to reduce the intake of red meat and to substitute poultry or fish. A medical team from Florida tracked beef and chicken consumption (in annual pounds per person) and found the consumption of beef declining and the consumption of chicken increasing from 1970 through the year 2000. A summary of their data is shown in the table.
 Consider fitting the following model, which allows for simultaneously fitting two simple linear regression lines: E(y) = 0+ 1x1 + 2x2+ 3x1x2 where
  Minitab printouts using this model are provided here.
Regression Analysis
The regression equation is
Y = -3020 + 4897 X1 + 1.55 X2 - 2.46 X1X2

 Analysis of Variance

 Predicted Value

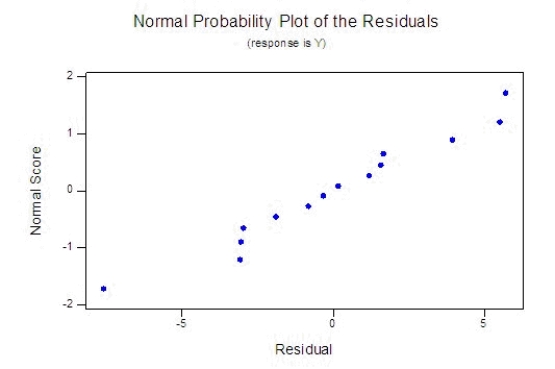
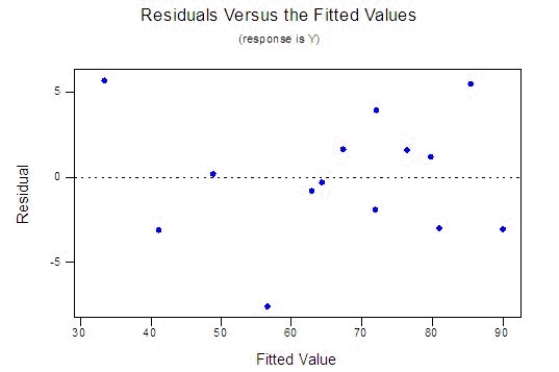 How well does the model fit? Use any relevant statistics and diagnostic tools from the printout to answer this question.
Test statistic:
F = ______________
p-value: ______________
Conclude:
The model ______________ significant information for the prediction of y.
Write the equations of the two straight lines that describe the trend in consumption over the period of 30 years for beef and for chicken.
For chicken:  = _______ + _______
  For beef:
  = _______ + _______
  Use the prediction equation to find a point estimate of the average per-person beef consumption in 2005.
  = ______________
Compare this value with the value labeled "Fit" in the printout.
______________
Use the printout to find a 95% confidence interval for the average per-person beef consumption in 2005.
The confidence interval is:
CI = ______________ Enter (n1, n2)
What is the 95% prediction interval for the per-person beef consumption in 2005?
The 95% prediction interval is:
PI = ______________ Enter (n1, n2)
Is there any problem with the validity of the 95% confidence level for these intervals?
__________________________________________
Definitions:
Meiosis
The process that produces sperm and ova, each of which contains only half of the parent cell’s original complement of 46 chromosomes.
Identical Twins
Twins who have developed from a single fertilized egg, sharing the same genetic makeup.
Monozygotic Twins
Identical twins that develop from a single fertilized egg, sharing the same genetics.
Dizygotic Twins
Also known as fraternal twins, are siblings that result from the fertilization of two different eggs by two different sperm cells, leading to the birth of genetically unique siblings.
Q12: The first step in a Wilcoxon rank
Q51: In a simple linear regression problem, the
Q67: Kruskal-Wallis test is a nonparametric test that
Q106: If a multiple regression model includes 10
Q116: In a randomized block design of ANOVA,
Q174: Three treatments were compared using a completely
Q197: In a Wilcoxon signed rank test, the
Q200: In testing the difference between two population
Q215: Which of the following is not a
Q251: A social worker was interested in determining