Evidence supports using a simple linear regression model to estimate a person's weight based on a person's height. Let x be a person's height (measured in inches) and y be the person's weight (measured in pounds). A random sample of eleven people was selected and the following data recorded: 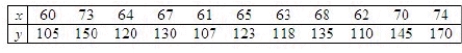 The following output was generated for the data:
 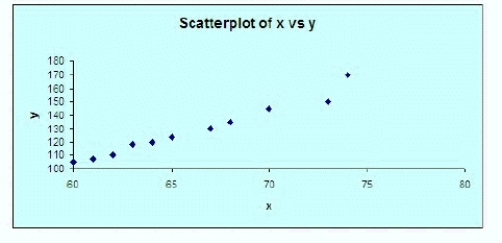 Based on the scatterplot above, does a simple linear regression model seem appropriate?
______________
Justify your answer.
________________________________________________________
Use the printout to find the least-squares prediction line.  = ______________
Based on the printout, do there appear to be any outliers in the data?
______________
Justify your answer.
________________________________________________________
Consider the following residual plot of the residuals versus the fitted values. 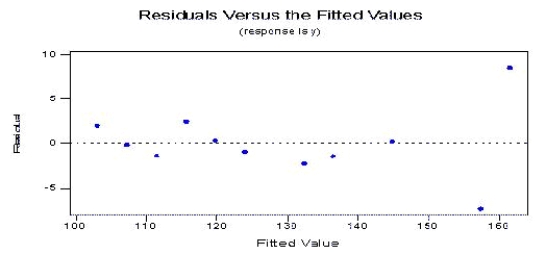 What conclusion, if any, can be drawn from the plot?
________________________________________________________
Consider the following normal probability plot of the residuals. 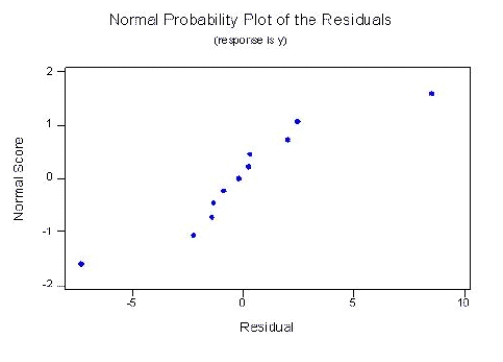 What conclusion can be drawn from the plot?
________________________________________________________
Based on the previous two plots, should you use the model in the computer printout to predict weight?
______________
Justify your answer.
________________________________________________________
Definitions:
Augmented Reality
An interactive experience of a real-world environment where objects in the real world are enhanced by computer-generated perceptual information.
Smart Speaker
A type of wireless speaker integrated with virtual assistant technology that offers interactive actions and hands-free activation through voice commands.
Ultimate Consumer
The end-user of a product or service who purchases or experiences it for personal use, not for resale or further production.
Augmented Reality
A technology that superimposes a computer-generated image on a user's view of the real world, providing a composite view.
Q13: In a two-way factor ANOVA with replications,
Q35: The analysis of variance (ANOVA) technique analyzes
Q43: When the necessary conditions are met, a
Q49: The area to the right of a
Q57: In a completely randomized design for ANOVA,
Q80: If the correlation coefficient for two variables
Q91: A microwave manufacturer has collected the data
Q136: In order to test the validity of
Q142: Consider the following ANOVA table: <img src="https://d2lvgg3v3hfg70.cloudfront.net/TB8220/.jpg"
Q158: In a simple linear regression analysis, it