Six points have these coordinates: 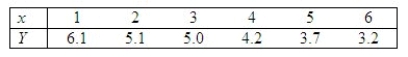 The normal probability plot and the residuals versus fitted values plots generated by Minitab are shown below.
 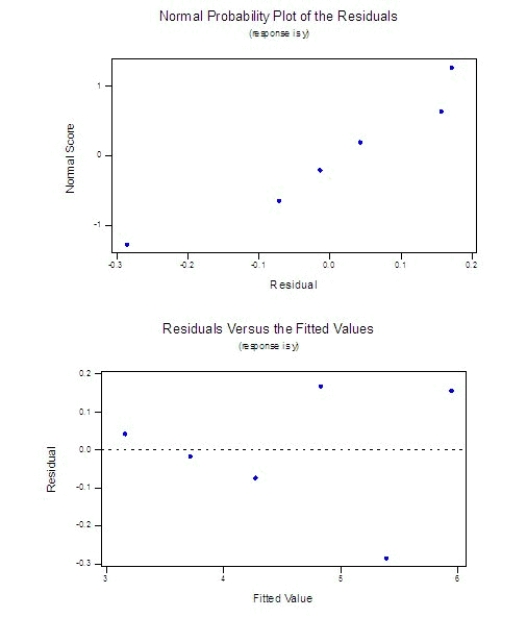 Does it appear that any regression assumptions have been violated?
______________
Explain.
________________________________________________________
Definitions:
Accounting System
A set of processes and tools used by entities to track financial transactions, maintain accurate records, and prepare financial statements.
Navigating QBO
The process of efficiently moving through QuickBooks Online’s interface to utilize its comprehensive features for managing financial tasks.
Financial Dashboard
A specialized dashboard focused on displaying key financial metrics and performance indicators to help in decision-making.
Recommended Tab
The Recommended Tab typically refers to a feature in software or online platforms that suggests options or items based on a user's past behavior, preferences, or popular trends.
Q36: Which of the following statements regarding multicollinearity
Q49: Multicollinearity is present if the dependent variable
Q50: In a normal approximation to the Wilcoxon
Q88: The area to the right of a
Q107: In the completely randomized design of ANOVA
Q116: Which of the following is not a
Q127: In testing <img src="https://d2lvgg3v3hfg70.cloudfront.net/TB8220/.jpg" alt="In testing
Q128: Consider the following two independent samples: Sample
Q147: The F-test of the randomized block design
Q155: A dog kennel manager was interested in