Examlex

Solved

Evidence Supports Using a Simple Linear Regression Model to Estimate

question 113

Essay

Evidence supports using a simple linear regression model to estimate a person's weight based on a person's height. Let x be a person's height (measured in inches) and y be the person's weight (measured in pounds). A random sample of eleven people was selected and the following data recorded: Evidence supports using a simple linear regression model to estimate a person's weight based on a person's height. Let x be a person's height (measured in inches) and y be the person's weight (measured in pounds). A random sample of eleven people was selected and the following data recorded:   The following output was generated for the data:   Based on the scatterplot above, does a simple linear regression model seem appropriate? ______________ Justify your answer. ________________________________________________________ Use the printout to find the least-squares prediction line.   = ______________ Based on the printout, do there appear to be any outliers in the data? ______________ Justify your answer. ________________________________________________________ Consider the following residual plot of the residuals versus the fitted values.   What conclusion, if any, can be drawn from the plot? ________________________________________________________ Consider the following normal probability plot of the residuals.   What conclusion can be drawn from the plot? ________________________________________________________ Based on the previous two plots, should you use the model in the computer printout to predict weight? ______________ Justify your answer. ________________________________________________________ The following output was generated for the data: Evidence supports using a simple linear regression model to estimate a person's weight based on a person's height. Let x be a person's height (measured in inches) and y be the person's weight (measured in pounds). A random sample of eleven people was selected and the following data recorded:   The following output was generated for the data:   Based on the scatterplot above, does a simple linear regression model seem appropriate? ______________ Justify your answer. ________________________________________________________ Use the printout to find the least-squares prediction line.   = ______________ Based on the printout, do there appear to be any outliers in the data? ______________ Justify your answer. ________________________________________________________ Consider the following residual plot of the residuals versus the fitted values.   What conclusion, if any, can be drawn from the plot? ________________________________________________________ Consider the following normal probability plot of the residuals.   What conclusion can be drawn from the plot? ________________________________________________________ Based on the previous two plots, should you use the model in the computer printout to predict weight? ______________ Justify your answer. ________________________________________________________ Based on the scatterplot above, does a simple linear regression model seem appropriate?
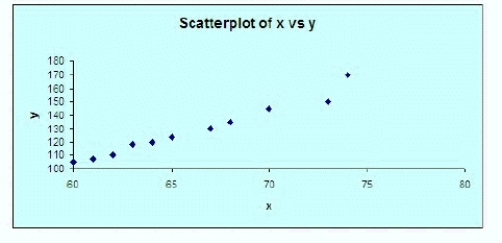
______________
Justify your answer.
________________________________________________________
Use the printout to find the least-squares prediction line. Evidence supports using a simple linear regression model to estimate a person's weight based on a person's height. Let x be a person's height (measured in inches) and y be the person's weight (measured in pounds). A random sample of eleven people was selected and the following data recorded:   The following output was generated for the data:   Based on the scatterplot above, does a simple linear regression model seem appropriate? ______________ Justify your answer. ________________________________________________________ Use the printout to find the least-squares prediction line.   = ______________ Based on the printout, do there appear to be any outliers in the data? ______________ Justify your answer. ________________________________________________________ Consider the following residual plot of the residuals versus the fitted values.   What conclusion, if any, can be drawn from the plot? ________________________________________________________ Consider the following normal probability plot of the residuals.   What conclusion can be drawn from the plot? ________________________________________________________ Based on the previous two plots, should you use the model in the computer printout to predict weight? ______________ Justify your answer. ________________________________________________________ = ______________
Based on the printout, do there appear to be any outliers in the data?
______________
Justify your answer.
________________________________________________________
Consider the following residual plot of the residuals versus the fitted values. Evidence supports using a simple linear regression model to estimate a person's weight based on a person's height. Let x be a person's height (measured in inches) and y be the person's weight (measured in pounds). A random sample of eleven people was selected and the following data recorded:   The following output was generated for the data:   Based on the scatterplot above, does a simple linear regression model seem appropriate? ______________ Justify your answer. ________________________________________________________ Use the printout to find the least-squares prediction line.   = ______________ Based on the printout, do there appear to be any outliers in the data? ______________ Justify your answer. ________________________________________________________ Consider the following residual plot of the residuals versus the fitted values.   What conclusion, if any, can be drawn from the plot? ________________________________________________________ Consider the following normal probability plot of the residuals.   What conclusion can be drawn from the plot? ________________________________________________________ Based on the previous two plots, should you use the model in the computer printout to predict weight? ______________ Justify your answer. ________________________________________________________ What conclusion, if any, can be drawn from the plot?
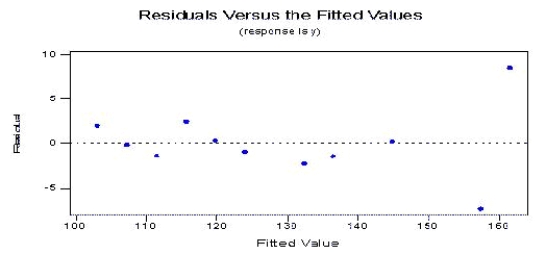
________________________________________________________
Consider the following normal probability plot of the residuals. Evidence supports using a simple linear regression model to estimate a person's weight based on a person's height. Let x be a person's height (measured in inches) and y be the person's weight (measured in pounds). A random sample of eleven people was selected and the following data recorded:   The following output was generated for the data:   Based on the scatterplot above, does a simple linear regression model seem appropriate? ______________ Justify your answer. ________________________________________________________ Use the printout to find the least-squares prediction line.   = ______________ Based on the printout, do there appear to be any outliers in the data? ______________ Justify your answer. ________________________________________________________ Consider the following residual plot of the residuals versus the fitted values.   What conclusion, if any, can be drawn from the plot? ________________________________________________________ Consider the following normal probability plot of the residuals.   What conclusion can be drawn from the plot? ________________________________________________________ Based on the previous two plots, should you use the model in the computer printout to predict weight? ______________ Justify your answer. ________________________________________________________ What conclusion can be drawn from the plot?
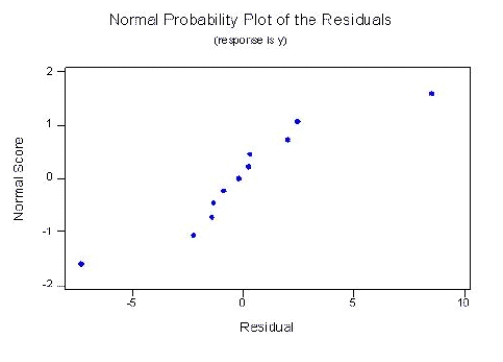
________________________________________________________
Based on the previous two plots, should you use the model in the computer printout to predict weight?
______________
Justify your answer.
________________________________________________________


Definitions:

Stable Environments

Conditions or contexts that are consistent and predictable over time, providing a steady framework for operations.

Mechanistic Organizational Structure

A highly formal, rigid, and bureaucratic structure characterized by centralized decision-making, clear divisions of labor, and strict hierarchies.

Formalization

The process of standardizing policies and procedures within an organization.

Hostile Environment

A work or social environment that is intimidating, unfriendly, or offensive, often due to harassment or discriminatory practices.

Related Questions