A food processor wants to compare two preservatives for their effects on retarding spoilage. Suppose 16 cuts of fresh meat are treated with preservative A and 16 are treated with preservative B, and the number of hours until spoilage begins is recorded for each of the 32 cuts of meat. The results are summarized in the table below: 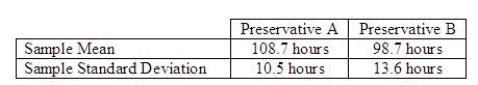 Calculate the value of the test statistic for testing the equality of the population variances, and write the proper conclusion for
  = 0.05.
Test statistic = ______________
Critical Value(s) = ______________
Conclusion: ______________
Interpretation: __________________________________________
Develop the 95% confidence interval estimate of the ratio of the two population variances.
______________
Definitions:
Vertical Axis
In a graph or chart, the vertical line or axis is typically used to represent the range of values for a dependent variable.
Consumption
The action of using up a good or service, typically one that satisfies human desires or needs.
Units
Standardized quantities used to measure, count, or quantify objects or phenomena.
Good X
A placeholder term commonly used in economics to refer to a generic good or product involved in an analysis or example.
Q18: In testing the validity of a multiple
Q18: If we wish to construct a 95%
Q22: Which of the following statements is false?<br>A)
Q22: Which of the following statements about ANOVA
Q52: If two variables are related in a
Q112: In the analysis of variance, the ANOVA
Q149: Let x be the area (in square
Q161: One-sided confidence bounds can be constructed for
Q201: An insurance company wants to test the
Q220: In an effort to raise ratings, a