The mean playing times (in hours) for 5 different co-ed volleyball games for two different teams are listed below. 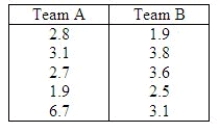 Is there sufficient evidence to conclude the mean playing time for the two teams differ? Assume the population distributions are normal and
  . Use a 0.05 significance level.
Test Statistic = ______________
Reject Region: Reject H0 if |t| > ______________
Conclusion: ______________
One ______________ conclude that there is sufficient evidence to claim the two teams have different playing times.
Definitions:
Normally Distributed
A type of distribution where data is symmetrically distributed around the mean, resembling a bell curve.
Population Variances
A measure of the dispersion or spread of a population's values, calculated as the average of the squared deviations from the population mean.
Ratio
A quantitative relationship between two numbers, showing how many times one value contains or is contained within the other.
F Table
A table used in statistics to determine the critical values of the F-distribution, often used in analysis of variance (ANOVA).
Q42: When two independent random samples of sizes
Q44: A two-tailed test of the population proportion
Q81: In the least squares regression line <img
Q100: A university admissions committee was interested in
Q131: One study revealed that the average child
Q133: If we first arrange test units into
Q150: The z-value needed to construct a 92.5%
Q157: Which of the following exemplifies a Type
Q163: A city bus driver claims that the
Q242: The t-distribution with n - 1 degrees