A councilman was interested in determining whether people between the ages of 18 and 30 years of age will react to a piece of legislation differently than people over 30 years of age. The legislator polled a sample of 150 people from his district. The resulting data is shown in the table below: 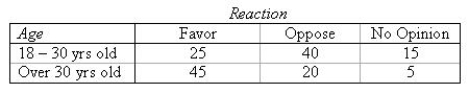 Construct a side-by-side bar chart.
Construct a pie chart for the 18 - 30 age group.
Construct a pie chart for the Over 30 age group.
Which of the two types of presentations in parts (a) and (b) is more easily understood?
______________
Definitions:
Wilcoxon Signed-Rank Sum Test
This is a type of statistical test that doesn't rely on predefined parameters and is utilized to analyze whether two related samples, matched samples, or repeated measures on a single sample have differing population mean ranks.
Matched Pair
A technique in experimental design where pairs of subjects are closely matched based on certain key characteristics, and one subject from each pair is assigned to each experiment group.
Nonzero Differences
Variations or disparities in data that are distinct from zero, indicating a measurable change or effect.
Parametric T-Test
A statistical test used to compare the means of two samples, assuming that the underlying populations have a normal distribution and known variance.
Q1: Which of the following Excel functions is
Q3: In most real-world inventory problems, lead time
Q31: Identify the seven steps involved in using
Q37: The learning curve for a product is
Q45: One of the advantages of simulation is
Q58: Let z denote a standard normal random
Q113: The graph of a discrete random variable
Q142: The sample z-score is a measure of
Q144: If a data set has 15 values
Q186: Given that Z is a standard normal