The number of household members, x and the amount spent on groceries per week, y (rounded to the nearest dollar) are measured for eight households in the Big Rapids area. The data are shown below: 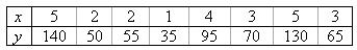 Create a raw scatterplot of these eight data points (no regression line or equation).
Find the best-fitting regression line for these data.
y = ______________
Plot the points and the best-fitting line on the same graph.
What would you estimate a household of seven to spend on groceries per week?
______________
Should you use the fitted line to estimate this amount?
______________
Why or why not?
________________________________________________________
Definitions:
Q14: The Las Vegas method is a simulation
Q14: A manufacturer of bike racks for cars
Q15: The expected number of heads in 500
Q17: A _ in Excel's Conditional Formatting changes
Q31: A coin toss experiment represents a binomial
Q34: Generally speaking, if two variables are unrelated
Q54: If Z is a standard normal random
Q63: Let x be a random variable with
Q118: Steve takes either a bus or the
Q179: Which measure of center is meaningful when