A neighborhood ice cream vendor would like to see if there is a relationship between day of the week and the number of children buying ice cream from her. The following data represent the number of children buying ice cream on each of the seven days of a particular week: 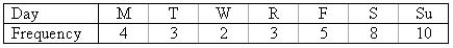
a. Construct a line chart to describe the data.
b. Is there any apparent trend in the data?
________________________________________________________
Definitions:
Per-Employee Expenditures
The amount of money spent by an organization for each employee, which can cover salaries, benefits, training costs, and other related expenses.
Employee Productivity
The measurement of the efficiency of an employee or group of employees in producing goods or services.
Flatter Organizational Structures
An organizational model with fewer hierarchical levels, intended to promote better communication and faster decision-making.
Management Functions
Management functions encompass planning, organizing, leading, and controlling organizational resources to achieve strategic goals.
Q2: The number of tires sold at a
Q18: Explain what is meant by the concept
Q21: There are two types of random variables:
Q52: Explain the three requirements of data integrity.
Q63: Let x be a random variable with
Q78: Stem and leaf plots are often used
Q102: A product was priced assuming a 75%
Q106: A concert hall, employing both ticket takers
Q113: A telephone survey of American families is
Q185: The standard deviation is a measure of