Figure: The Optimal Quantity
 (Figure: The Optimal Quantity) Look at the figure The Optimal Quantity.If the cost of producing lawn-mowing increased, the ________ curve in the figure would shift to the and the total
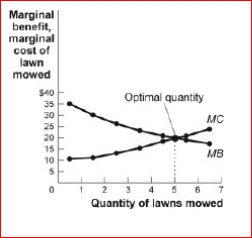
net gain would _.
A.marginal benefit; right; increase
B.marginal cost; right; increase
C.marginal benefit; left; decrease
D.marginal cost; left; decrease
Definitions:
Dropout Rates
Dropout Rates refer to the percentage of students who discontinue their education before completing a given level or degree.
Transfer Payments
Payments made by the government to individuals without any goods or services being exchanged, such as social security or unemployment benefits.
Government Payments
Financial transfers from the government to individuals, businesses, or other governments, often in the form of subsidies, benefits, or grants.
Income Mobility
The ability of individuals or families to move up or down the economic ladder within a lifetime or from one generation to the next.
Q19: type of address that is automatically assigned
Q29: (Table: Production Possibilities) Look at the table
Q43: How can an IPv6 interface ID be
Q69: Which of the following taxes best illustrates
Q84: Figure: The Production Possibilities for Two Countries<br>
Q135: Figure: The Marginal Cost Curve<br>(Figure: The Marginal
Q198: If Japan levies tariffs on U.S.goods entering
Q224: State governments place excise taxes on alcohol
Q234: Figure: The Market for Blue Jeans<br>(Figure: The
Q257: Which model states that nations that are