Figure: The Demand Curve for Crossings 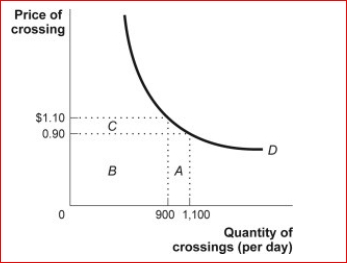
 (Figure: The Demand Curve for Crossings) Look at the figure The Demand Curve for Crossings.This graph examines the demand for crossing a bridge over a very large river.Using the midpoint method, the price elasticity of demand between $0.90 and $1.10 is approximately:
Definitions:
Spot Price
The current market price at which a particular asset can be bought or sold for immediate delivery.
Arbitrage Opportunities
Situations where a trader can make a profit from the price difference of a security or commodity in two different markets without risk.
Spot Price
The current market price at which a particular asset, such as a commodity, currency, or security, can be bought or sold for immediate delivery.
Gold
A precious metal that serves as a form of investment, currency, and store of value, historically used to hedge against inflation and currency devaluation.
Q14: The price elasticity of demand is the
Q16: Which of the following is not a
Q40: Price ceilings that lead to shortages will
Q45: Criteria that economists use in selecting a
Q142: The price elasticity of demand for fresh
Q147: Suppose the price elasticity of demand for
Q150: If I told you that the income
Q182: If Japan levies tariffs on U.S.goods entering
Q226: Advocates of trade barriers suggest that barriers
Q264: Figure: The Market for Yachts<br> <img src="https://d2lvgg3v3hfg70.cloudfront.net/TB1063/.jpg"