Figure: The Demand Curve 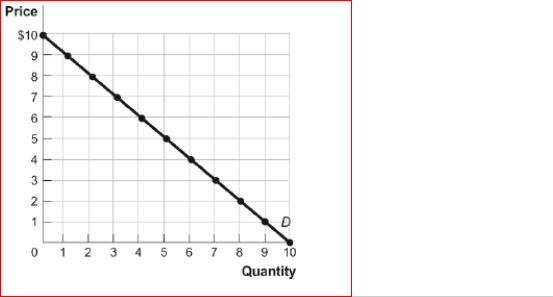 (Figure: The Demand Curve) Look at the figure The Demand Curve.Using the midpoint method, the price elasticity of demand between $8 and $9 is approximately:
Definitions:
Price of Capital
The cost incurred to use capital goods for production, often determined by interest rates and market demand.
Total Expenditures
The total amount of money spent by a firm or an individual on goods and services.
Price of Labor
The wage rate or compensation paid to employees for their work or services, determined by supply and demand in the labor market.
Isocost Line
A line that represents all combinations of inputs which cost the same total amount.
Q25: Given a price increase for any good,
Q60: (Figure: A Tariff on Oranges in South
Q63: Figure: The Market for Blue Jeans<br>(Figure: The
Q63: Critics of the pharmaceutical industry often argue
Q118: If the government follows an income tax
Q155: Figure: The Market for Laptop Sleeves<br> <img
Q203: Figure: Supply and Demand<br>(Figure: Supply and Demand)
Q233: If an excise tax is imposed on
Q259: The percent change in quantity demanded divided
Q266: What would happen in the market for