Figure: Estimating Price Elasticity
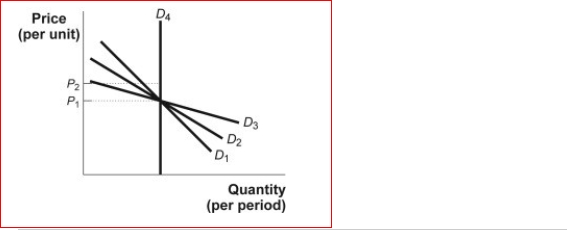 (Figure: Estimating Price Elasticity) Look at the figure Estimating Price Elasticity.Between the two prices, P₁ and P₂, which demand curve has the lowest price elasticity?
A.D1
B.D2
C.D3
D.D4
Definitions:
Non-Systematic
Lacking a fixed plan, method, or coherence, often in a way that makes something less effective or reliable.
Qualitative Process
An approach that focuses on understanding complex phenomena through non-numerical data, emphasizing the quality and depth of insights over quantification.
Prevailing Market
The current conditions in a market, including aspects like prices, demand, and supply, influencing business decisions.
CPI
Consumer Price Index, a measure that examines the weighted average of prices of a basket of consumer goods and services, such as transportation, food, and medical care.
Q2: (Figure: Rent Controls) Look at the figure
Q7: U.S.federal taxes are generally , while state
Q13: When there is a bountiful harvest of
Q15: If the government imposes a per-unit tax
Q36: Figure: The Market for e-Books<br>(Figure: The Market
Q93: (Table: The Market for Acupuncture) Look at
Q142: Figure: The Market for Calculators<br>(Figure: The Market
Q171: If the price of burritos increases from
Q175: The two most important sources of federal
Q186: Suppose Governor Meridias decides to initiate a