Figure: The Linear Demand Curve
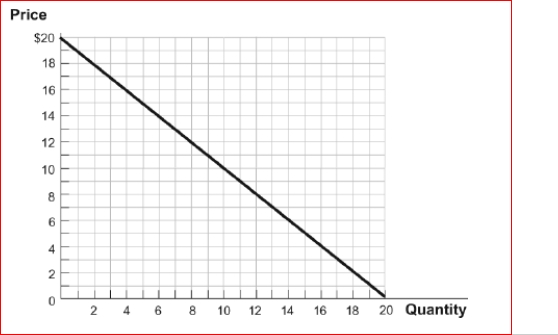 (Figure: The Linear Demand Curve) Look at the figure The Linear Demand Curve.If the price is initially $10, then falls to $9, this will result in a(n):
A.decrease in quantity demanded and a decrease in total revenue.
B.decrease in quantity demanded and an increase in total revenue.
C.increase in quantity demanded and a decrease in total revenue.
D.increase in quantity demanded and an increase in total revenue.
Definitions:
Relationship Marketing
A marketing strategy focused on building long-term engagement and loyalty with customers through personalized interactions and communications.
Customer Service
The assistance and advice provided by a company to those people who buy or use its products or services.
Retention Marketing
Retention marketing focuses on strategies and actions aimed at retaining existing customers, enhancing their loyalty, and increasing their lifetime value to the business.
Temporal Factor
A variable related to time that influences outcomes, events, or processes, including duration, timing, and sequence.
Q71: The deadweight loss of an excise tax
Q91: A student organization is formed on your
Q107: Suppose the equilibrium rent for apartments in
Q118: An increase in producer surplus would most
Q125: A maximum price set below the equilibrium
Q162: Figure: Market I<br>A.$15.<br>B.$9.<br>C.$6.<br>D.$0.
Q167: If the price of mozzarella cheese (an
Q212: The argument for progressive taxes is based
Q247: An announcement that smoking will harm your
Q286: (Table: Johnson's Income and Expenditures) Look at