Figure: The Demand Curve for Bridge Crossings
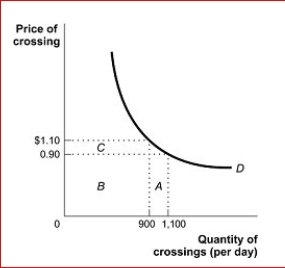
 (Figure: The Demand Curve for Bridge Crossings) Look at the figure The Demand Curve for Bridge Crossings.The price elasticity of demand between $0.90 and $1.10 in the figure is:
A.price-elastic, since the price elasticity is less than 1.
B.price unit-elastic, since the price elasticity is equal to 1.
C.price-elastic, since the price elasticity is a negative number.
D.price-inelastic, since the price elasticity is less than 1.
Definitions:
Short-Run Aggregate Supply Curve
A graphical representation that shows the relationship between the total production of goods and services at different price levels in the short term.
Cost of Production
The total expense incurred in manufacturing a product or providing a service, including raw materials, labor, and overhead costs.
Actual Price Level
The current index of the price of goods and services in an economy, reflecting the purchasing power of money and the cost of living at a certain time.
Short-Run Aggregate Supply Curve
A graphical representation that shows the relationship between the price level and the quantity of goods and services that producers are willing and able to supply in the short run.
Q82: A local restaurant has estimated that the
Q86: If the U.S.government imposes a quota on
Q88: Which of the following statements is true?<br>A.When
Q119: If the cross-price elasticity of demand between
Q138: Figure: The Demand for Shirts<br> <img src="https://d2lvgg3v3hfg70.cloudfront.net/TB1063/.jpg"
Q199: The administrative costs of a tax include
Q208: To minimize deadweight loss, excise taxes should
Q213: If the demand for golf is unit-price
Q220: A tax that takes a fixed percentage
Q225: The demand for textbooks is price inelastic.Which