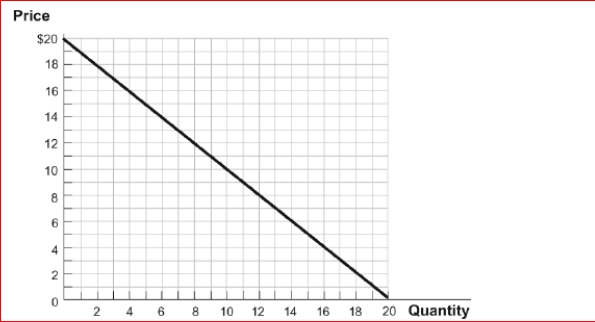
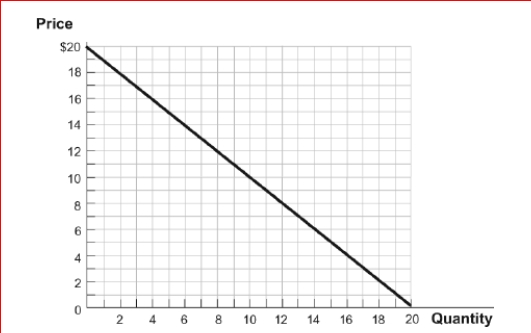
Figure: The Linear Demand Curve


 (Figure: The Linear Demand Curve) Look again at the figure The Linear Demand Curve.As a producer, you are interested in maximizing your total revenues in this market.What is the price at which you should sell your good? What is the corresponding total revenue?
A.$10; $100
B.$20; $200
C.$0; $100
D.$5; $100
Definitions:
Japan
An island nation in East Asia, known for its rich cultural heritage, technological innovation, and significant economic power.
Economies of Scale
Cost advantages achieved when an enterprise increases production and efficiency, reducing the cost per unit.
Natural Monopolies
A type of monopoly that occurs when a single firm can supply a good or service to an entire market at a lower cost than two or more firms.
Patents
Legal rights granted to inventors or assignees for a certain period of time, allowing them to exclude others from making, using, or selling an invention.
Q12: Figure: The Market for Blue Jeans<br>(Figure: The
Q38: <img src="https://d2lvgg3v3hfg70.cloudfront.net/TB1063/.jpg" alt=" (Table: Market for
Q39: If there is a decrease in supply,
Q45: Suppose the government sets a price floor
Q83: The law of demand implies that:<br>A.consumers are
Q89: In much of the country, homeowners choose
Q112: Figure: The Shrimp Market<br> <img src="https://d2lvgg3v3hfg70.cloudfront.net/TB1063/.jpg" alt="Figure:
Q184: To dispose of the unwanted surplus resulting
Q187: (Table: Consumer Surplus) Look at the table
Q218: The price of coffee increases by 10%,