Figure: Consumer Surplus II
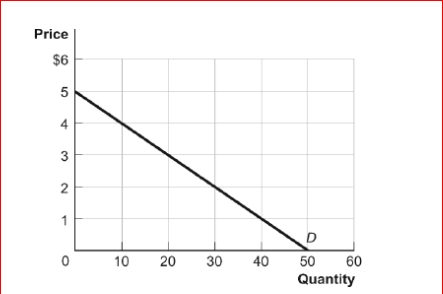
 (Figure: Consumer Surplus II) Look at the figure Consumer Surplus II.If the price of the good decreases from $2 to $1, consumer surplus will increase by:
A.$5.
B.$10.
C.$25.
D.$35.
Definitions:
Sales Dollars
The total revenue generated from the sale of goods or services, measured in dollar amount.
Common Fixed Expenses
Expenses that remain constant in total regardless of changes in the level of activity or volume of output.
Break-even
The point at which total cost and total revenue are equal, meaning there is no net loss or gain.
Net Operating Income
The total profit of a company after operating expenses but before deducting interest and taxes.
Q5: Quantity controls set below the equilibrium quantity
Q60: Figure: Demand and Supply<br>(Figure: Demand and Supply)
Q72: Figure: Hot Drinks Sold and Temperature<br> <img
Q123: If the government were to intervene in
Q125: A maximum price set below the equilibrium
Q138: Figure: The Market for Sandwiches<br>(Figure: The Market
Q155: (Table: Supply of Lemonade) Look at the
Q156: (Figure: Rent Controls) Look at the figure
Q181: A perfectly elastic supply curve is:<br>A.horizontal.<br>B.downward sloping.<br>C.upward
Q207: Figure: The Linear Demand Curve<br> <img src="https://d2lvgg3v3hfg70.cloudfront.net/TB1063/.jpg"