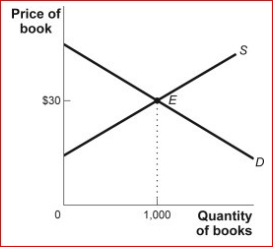
Figure: Consumer and Producer Surplus

 (Figure: Consumer and Producer Surplus) Look at the figure Consumer and Producer Surplus.In the accompanying figure, an increase in supply will:
A.increase consumer surplus.
B.decrease producer surplus.
C.increase total surplus.
D.increase consumer surplus and total surplus.
Definitions:
Output
The total amount of goods or services produced by a company, industry, or economy within a specific period.
Supply Curve
A graphical representation showing the relationship between the price of a good or service and the quantity of that good or service that a supplier is willing and able to supply.
Total Variable Costs
The sum of all costs that vary with the level of output, including materials and labor directly involved in the production process.
Output
The total amount of goods or services that are produced by a company or an economy.
Q27: Figure: Supply Curves<br>(Figure: Supply Curves) Look at
Q37: Figure: Unemployment Rate over Time<br> <img src="https://d2lvgg3v3hfg70.cloudfront.net/TB1063/.jpg"
Q55: Figure: The Wireless Mouse Market<br> <img src="https://d2lvgg3v3hfg70.cloudfront.net/TB1063/.jpg"
Q80: Scenario: Choosing Insurance The Ramirez family owns
Q111: In the market for tacos, you observe
Q165: Floyd's cost of selling haircuts is the
Q168: If the price elasticity of supply is
Q174: A minimum price set above the equilibrium
Q187: An ambiguous change in price and a
Q197: A new wonder diet that results in