Figure: Monopoly Model
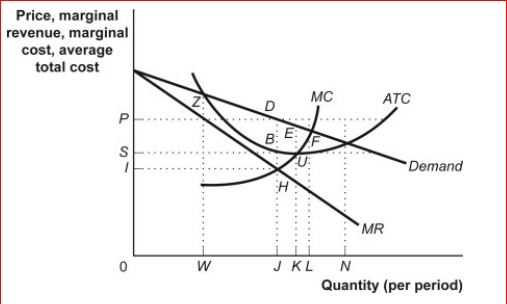
 (Figure: Monopoly Model) Look at the figure Monopoly Model.When the firm is in equilibrium (that is, maximizing its economic profit), its profit is the area of rectangle:
A.SPDB.
B.IPDH.
C.ISBH.
D.0PDJ.
Definitions:
Producer Surplus
The difference between the amount producers are willing and able to sell a product for and the actual amount they receive, often representing profit.
Total Surplus
The total net gain for society derived from the creation and utilization of goods or services, calculated as the combined value of consumer and producer surplus.
Net Welfare Gain
The improvement in societal well-being, measured as the sum of consumer and producer surplus, arising from economic transactions or policy changes.
Perfect Competition
A market structure characterized by a large number of small firms, identical products, and easy entry and exit, which leads to firms being price takers.
Q2: (Figure: The Profit-Maximizing Output and Price) Look
Q3: Price-takers are individuals in a market who:<br>A.select
Q20: General Snacks is a typical firm in
Q27: In perfect competition:<br>A.a firm's total revenue is
Q71: To be called an oligopoly, an industry
Q80: Scenario: Monopolistically Competitive Firm A monopolistically competitive
Q86: Tacit collusion is difficult to achieve in
Q139: Goods that are subject to network externalities
Q204: Figure: The Market for Gas Stations <img
Q227: Many hotel chains offer discounts for senior