Figure: Demand, Revenue, and Cost Curves
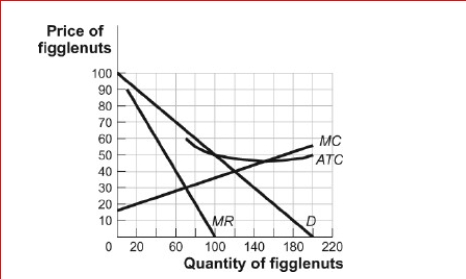
 (Figure: Demand, Revenue, and Cost Curves) Look at the figure Demand, Revenue, and Cost Curves.The figure shows the demand, marginal revenue, marginal cost, and average total cost curves for Figglenuts-R-Us, a monopolist in the figglenut market.If the government regulated the figglenut market by setting a price ceiling of $40, Figglenuts-R-Us might:
A.produce 60 figglenuts to maximize profit.
B.produce 120 figglenuts to maximize profit.
C.shut down in the short run.
D.increase the price to $60.
Definitions:
Suppress
means to put an end to the activities or expressions of something, often by force or inhibition.
Pretend
Act of simulation or feigning; behaving as if something is the case when in fact it is not.
Dysfunctional Conflict
A disagreement or conflict that leads to negative outcomes, disrupting group harmony or individual performance.
Absenteeism
the habitual non-presence of an employee at their job, often without good reason.
Q1: Bob runs a pedicure business in a
Q41: Figure: Monopolistic Competition II <img src="https://d2lvgg3v3hfg70.cloudfront.net/TB1063/.jpg" alt="Figure:
Q70: (Table: Demand Schedule for Gadgets) Look at
Q135: (Table: Variable Costs for Lawns) Look at
Q172: An analytical approach through which strategic choices
Q173: (Figure: The Profit-Maximizing Output and Price) Look
Q193: Figure: Pricing Strategy in Cable TV Market
Q211: For a firm in a perfectly competitive
Q226: Suppose that the Yankee Cap Company is
Q235: A monopolist or an imperfectly competitive firm