Figure: Short-Run Costs II 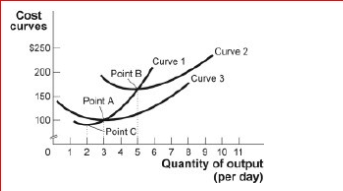
 (Figure: Short-Run Costs II) Look at the figure Short-Run Costs II.Curve 1 crosses the average variable cost curve at:
Definitions:
Weaker Arguments
Arguments that lack sufficient evidence or logical coherence, making them less persuasive or convincing.
Strong Points
The strengths or particularly capable aspects of something or someone, typically highlighting areas of proficiency or effectiveness.
Attractive Models
Individuals who are used in media and marketing that fit societal standards of beauty, often influencing consumer behavior.
Classical Conditioning
A learning paradigm where two stimuli are persistently paired; the response initially provoked by the second stimulus eventually becomes provoked by the first stimulus.
Q31: (Table: Total Cost and Output) The table
Q40: In the long run:<br>A)the firm considers all
Q68: Figure: The Monopolist<br> <img src="https://d2lvgg3v3hfg70.cloudfront.net/TB1063/.jpg" alt="Figure: The
Q135: Assume that Maia spends all her income
Q144: A perfectly competitive firm's demand curve is
Q217: (Table: Optimal Choice of Milk and Honey)
Q220: In economics, the short run is:<br>A)less than
Q260: In the short run, if P =
Q318: Patrick enjoys consuming chocolate but really detests
Q442: Jill Smith, a careful utility maximizer, consumes