Figure: Indifference Curves and Consumption Bundles 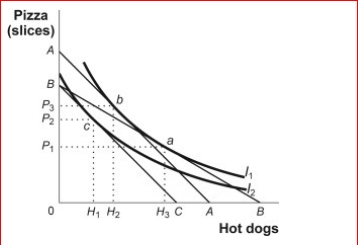
 (Figure: Indifference Curves and Consumption Bundles) Look at the figure Indifference Curves and Consumption Bundles.In the figure, the initial optimum is at a.The price of hot dogs increases, and the new equilibrium point is c.The change in hot dog consumption due to the income effect of the price change is:
Definitions:
Long-Run Equilibrium
A state in which all inputs and outputs in an economy are fully adjusted so that there is no tendency for change.
Price Level
The average of current prices across the entire spectrum of goods and services produced in the economy, an indicator of inflation.
Real GDP
The measure of a country's economic output adjusted for price changes (inflation or deflation), reflecting the real value of goods and services produced.
Short-Run Economic Recession
A brief period of economic decline characterized by reduced industrial production, trade, and lowered levels of employment.
Q30: Figure: A Firm's Cost Curves <img src="https://d2lvgg3v3hfg70.cloudfront.net/TB1063/.jpg"
Q48: If they spend all night writing computer
Q99: (Table: Variable Costs for Lots) Look at
Q107: (Table: Utility from Candy Bars and Sodas)
Q142: (Table: Bonnie's Production Function for Good Z)
Q149: Scenario: Music Downloads and Streamed Movies Phillip
Q152: Figure: The Average Total Cost Curve<br>(Figure: The
Q208: Which of the following statements is true?<br>A.If
Q347: (Table: Utility of Pecan Rolls) Look at
Q359: Which of the following statements is true?<br>A)Calculating