Figure: Harold's Indifference Curves The figure shows three of Harold's indifference curves for bread and cheese. 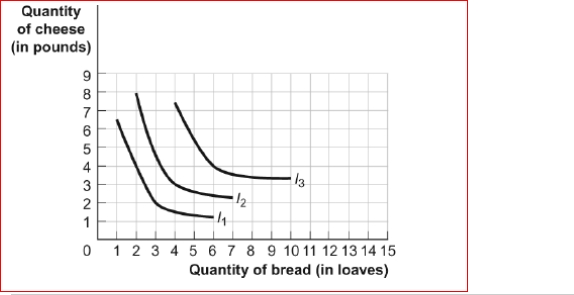 (Figure: Harold's Indifference Curves) Look at the figure Harold's Indifference Curves.If the price of bread is $2 per loaf, the price of cheese is $2, and Harold has $10 to spend on bread and cheese, what is Harold's optimal consumption bundle of bread and cheese?
Definitions:
Transaction
The act of conducting a trade or business deal involving the exchange of goods, services, or financial assets.
Signaling
A concept in economics and finance where agents indirectly convey information about their qualities or intentions through their actions.
Liquidity
With respect to a company, the ability to pay its bills in the short run. With respect to an asset, the readiness with which it can be converted to cash.
Matching Savers
A concept in finance referring to the alignment of investors' preferences with appropriate investment opportunities.
Q33: A perfectly competitive firm will produce:<br>A)whenever it
Q47: Adam has a monthly income of $20
Q64: Which of the following statements is true?<br>A.A
Q103: As more labor is added to a
Q136: You own a small deli that produces
Q184: A market that is in long-run equilibrium
Q210: (Table: Optimal Choice of Milk and Honey)
Q232: Adam has a monthly income of $20
Q271: Suppose the marginal cost curve in the
Q296: If the combination of two goods occurs