Figure: Consumer Equilibrium I The figure shows three of Owen's indifference curves for pizza and soda per week.Owen has $180 per month to spend on the two goods, and the price of a pizza is $20 and the price of a soda is
$1) 50. 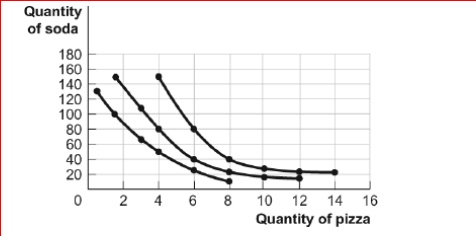
 (Figure: Consumer Equilibrium I) Look at the figure Consumer Equilibrium I.If Owen consumes 1.5 pizzas and 100 sodas, which of the following describes the relationship between his marginal rate of substitution of pizza in place of soda and the relative price of pizza in terms of soda?
Definitions:
Q23: (Table: Labor and Output) Look at the
Q37: A production possibility frontier that is a
Q91: In the short run, if a perfectly
Q119: (Table: Costs of Producing Bagels) Look at
Q135: (Table: Variable Costs for Lawns) Look at
Q301: (Table: Utility from Burgers and Milkshakes) Look
Q387: Sam always tries to maximize his utility
Q397: After learning about indifference curves, Sandy realizes
Q401: One point on an indifference curve drawn
Q452: If the price of a cookie is