 Figure: Budget Lines for Oranges and Apples
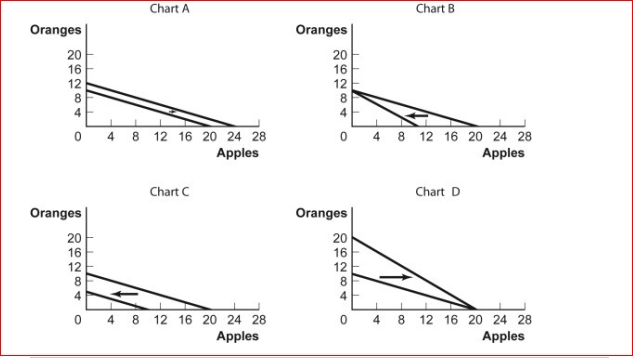
(Figure: Budget Lines for Oranges and Apples) Look at the figures Budget Lines for Oranges and Apples.For some time, Antonio has had $5 per month to spend on oranges and apples.The price of an orange is $0.50 and the price of an apple is $0.25.Which of the charts shows what will happen to his budget line if his income decreases to $2.50?
A.Chart A
B.Chart B
C.Chart C
D.Chart D
Definitions:
Profit To Distributors
The financial gain that distributors achieve from selling products after accounting for their cost of goods sold and operating expenses.
Production Era
A period in business thought where the main focus was on manufacturing efficiency and product output, with little attention to the consumer.
Marketing Concept
A business philosophy that holds that the key to achieving organizational goals consists of the company being more effective than competitors in creating, delivering, and communicating customer value.
Customer Relationship
The approach and techniques a business uses to manage and analyze interactions with its customers, aiming to improve loyalty and grow sales.
Q62: Figure: Income and Substitution Effects<br>(Figure: Income and
Q107: (Table: Fish and Coconut Production Possibilities) Look
Q109: Economic models often:<br>A.vary greatly in assumptions and
Q135: Assume that Maia spends all her income
Q142: Consumption bundles that yield equal levels of
Q159: (Table: Consumer Equilibrium) Look at the table
Q161: LaToya sees honey and sugar as perfect
Q164: In movement along a production possibility frontier,
Q214: Figure: Tom's Production Possibilities<br>(Figure: Tom's Production Possibilities)
Q473: Professor Makrung spends his entire weekly income