Figure: Budget Lines for Oranges and Apples
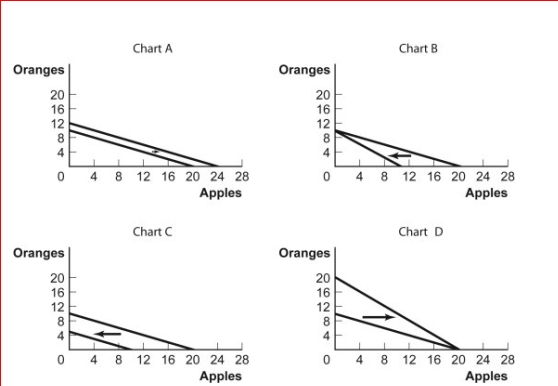
 (Figure: Budget Lines for Oranges and Apples) Look at the figures Budget Lines for Oranges and Apples.For some time, Antonio has had $5 per month to spend on oranges and apples.The price of an orange is $0.50 and the price of an apple is $0.25.Which of the charts shows what will happen to his budget line if the price of an orange falls to $0.25?
A.Chart A
B.Chart B
C.Chart C
D.Chart D
Definitions:
Quantity Supplied
The amount of a product or service that producers are willing and able to sell at a given price level during a specific time period.
Inelastic Demand
A market situation in which the demand for a product does not significantly change with its price increase or decrease.
Total Revenues
The entire amount of income generated by a company from its business activities, before any expenses are subtracted.
Fixed Costs
Costs that do not change with the level of output or sales, such as rent, salaries, and loan payments.
Q1: Title VII of the Civil Rights Act
Q16: Suppose residents of Montana operate on their
Q24: An economy is said to have a
Q26: If a firm has lower costs per
Q29: Diminishing marginal utility is the reason most
Q50: If the price of a ticket to
Q55: When a nation experiences economic growth:<br>A.its production
Q208: Which of the following statements is true?<br>A.If
Q329: How is a utility function different from
Q386: Alison is a traveling salesperson who drives